Deflection is the wrong number: measure whether the task finished
A deflection rate scores a user who gave up the same as one who was helped. What Gartner's own self-service figures show, and what to count instead.
About this article
A deflection rate counts sessions that ended without a ticket, so it scores a user who gave up identically to a user who was helped. Gartner reported in 2024 that 73% of customers use self-service somewhere in a journey while only 14% fully resolve there. Measure task completion per journey, and write the handover rules as counts rather than model confidence.
The first version of this post explained how to model the cost savings from deflecting support tickets with an in-app agent. It had a worked example with ticket volumes, a cost per contact, and a deflection percentage. Every one of those numbers was invented, and the arithmetic on invented numbers is a genre rather than an analysis.
The replacement argument is more useful and slightly less comfortable: deflection is a measurement of your cost, presented as a measurement of your product, and the two come apart in a specific and predictable way.
This matters before you build, not after. What an agent costs to own is a five-part answer, and whichever number you pick to justify the spend is the number the project will be steered by for its first year.
What a deflection rate actually counts#
Deflection counts sessions that ended without creating a ticket. That definition is indifferent to why. A user who got their answer and a user who closed the app in frustration produce the same row in the same table, and the second one is cheaper, because they will not be back to file anything.
The figures that make this concrete come from Gartner. CX Today reported in August 2024 on a Gartner survey of 5,728 customers finding that only 14% of customer service issues were fully resolved through self-service. Eric Keller, senior director of research in Gartner’s customer service and support practice, put the gap plainly: “While 73% of customers use self-service at some point in their customer service journey, it’s concerning to see that so few fully resolve there.”
Seventy-three per cent start. Fourteen per cent finish. A deflection metric that counts sessions will report most of that difference as a win, because each abandoned session closed without a ticket.
Where the other journeys go#
Customer Experience Dive, reporting on a 2024 Gartner survey, notes that nearly nine in ten customer service journeys beginning in self-service are ultimately resolved through multiple channels. The sample size behind that specific figure is not given in the reporting, so treat the shape rather than the decimal.
The shape is what matters. A journey that starts in your app and ends on the phone has not been deflected; it has been delayed and made more expensive, because the phone agent now starts from zero with a customer who has already failed once.
There is a version of this that harms the business in a quieter way. Writing on saas.group, the argument is that deflection removes contact along with friction: “For your happiest customers, that’s pure win. For your at-risk customers, you’ve automated away your early-warning system.” That post’s figure about a bot absorbing half of inbound tickets within a quarter is the author’s own assertion with no source attached, so read the argument and leave the number. The argument stands on its own, and its practical form is a rule worth stealing: “Any account that contacts support three times in thirty days gets a human touchpoint, no matter how well the bot handled each ticket.”
A note on the numbers you will be shown#
Vendor research in this space is abundant and it mostly measures expectations. Zendesk’s 2025 CX Trends report, based on a vendor-run survey of roughly 5,100 consumers and 5,400 customer service leaders across 22 countries in June and July 2024, reports that 75% of CX leaders expect 80% of customer interactions to be resolved without human intervention within a few years.
That is a forecast about a forecast. It tells you what leaders believe, which is genuinely useful for understanding where budget is going, and it tells you nothing about what any deployed system currently resolves. The same report carries figures that do describe outcomes, and the two kinds sit side by side without being labelled. Read every statistic in this category by asking whether it describes something that happened or something somebody expects.
What to measure instead#
Task completion, defined per journey and evidenced by a state change in your own system.
The state change is the useful part. “Did the user reorder” is answerable from your own database. “Did the refund get issued” is answerable. “Was the appointment moved” is answerable. These are not survey questions and they do not depend on anyone rating anything.
Three supporting measures make that number readable.
Contact rate for the same task within seven days tells you about the journeys that looked finished and were not. If completion goes up and repeat contact goes up with it, something is finishing in your logs and not in the user’s life.
Handover quality, measured as whether the human who received the escalation had the context, is the one that most affects how the feature is perceived internally. A support team whose escalations arrive with the full transcript and the tool results will defend the agent. A team that receives “customer needs help” will not.
And time to resolution across the whole journey, including the channels the agent handed to. This is the number that gets worse when deflection improves, which is why it belongs on the same dashboard.
The metric set in full covers instrumentation, and it is worth settling these definitions before the feature ships, because the first board slide will fix whichever one you happened to have.
The handover rules belong in code#
The common design mistake is to let the model decide when to escalate, usually through a prompt instruction about admitting uncertainty. This fails in the exact case it was written for: the model that has misunderstood the question does not know it has, and reports no uncertainty at all.
Count things instead. A second attempt at the same task in one session. A tool error the agent has no branch for. Anything touching money, safety or account closure, which should never reach the model’s discretion. And the frequency rule above, which operates at the account level over weeks rather than inside a session.
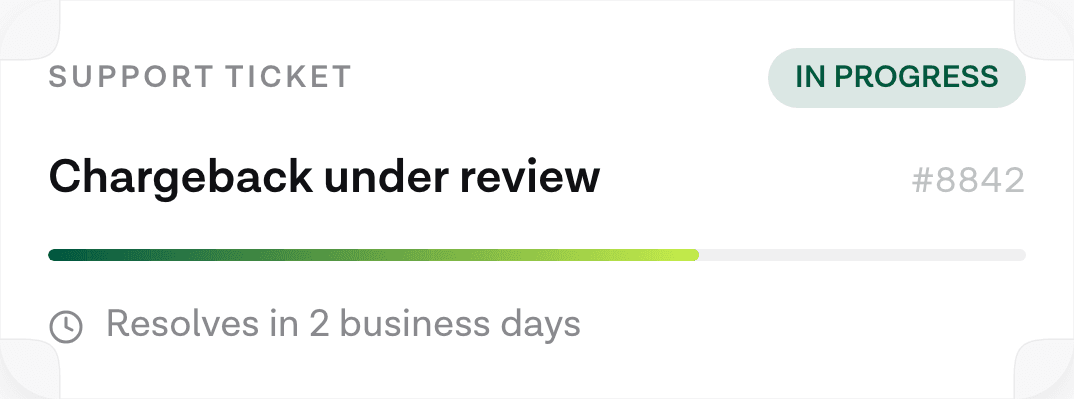
Handover is a feature, not a failure state, and building it as a rendered outcome changes how it feels. An agent that draws a callback card with a time, or opens a ticket with the transcript attached and shows the reference number, has finished the job it could do and passed the rest on legibly.
What an in-app agent does that a help centre cannot#
None of the above argues against automating support. It argues against measuring it with a number that cannot fail.
The genuine advantage of an agent inside the app is that it is authenticated and it has tools, which is true of neither a help centre nor a phone line. A help centre article can tell a user how to change a delivery address. An agent that is already signed in as that user can read the order, check whether it has shipped, and change the address if it has not, then show them the updated order.
That difference reframes the whole measurement problem. A help centre can only ever be measured on deflection, because reading an article is the only thing it can do. An agent can be measured on completion, because completion is a state change in a system it can reach. If you are building the second thing and reporting on it like the first, you have given up the only metric that would have told you it was working.
It also changes which contacts are worth routing to it. The tasks where an agent wins are the ones where the user’s intent is clear and the execution is buried: a status they cannot find, a change they are allowed to make, a document they are entitled to. The tasks where it loses are the ones requiring judgement, exception handling or an apology from a person with authority to make one.
When the answer is that you do not need this#
Some support volume is a symptom of a product problem, and an agent that answers the question well is a way of not fixing it. If a third of your contacts are people who cannot find a setting, the agent will handle them beautifully and the setting will stay hidden for another two years.
The test is whether the underlying task is inherently conversational. Reordering, checking a status, moving a booking and answering a question about an account are conversational. “Where is the export button” is not; it is a navigation defect wearing a support costume. When not to add an agent covers that distinction properly, and whether you need an agent or a chatbot covers the case where the answer is a much smaller piece of software.
If you do want one, the category and what it is made of is the starting point, and the tool and widget reference covers the tool and handover surfaces described above.
Sources#
- CX Today, “Only 1 in 7 Customer Service Queries Resolved With Self-Service, Gartner Study Finds”, 19 August 2024, reporting a Gartner survey of 5,728 customers.
- Customer Experience Dive, “CX leaders say self-service, live chat will overtake phone and email”, citing a 2024 Gartner survey.
- saas.group, “What AI support deflection quietly costs you in retention”. An argument, not a study; its ticket-volume figure is unsourced.
- Zendesk, “CX Trends 2025”, vendor-run survey of about 5,100 consumers and 5,400 CX leaders across 22 countries, June to July 2024.
Next
The reference for what this post describes.
Read the docsThe rest of Business
Open the clusterBuild versus buy, what an agent changes about activation and support load, and the measurements that tell you before the quarter ends.
- How to add an AI agent to a mobile app: the complete guideWhat an in-app agent is made of, what each of its five pieces costs to own, and the honest path from a first spoken turn to something you can hand to users.12 min
- What typing on a phone actually costs your appPeople type about 36 words a minute on a phone. Here is what the research measures, what it does not, and why the fix is removing the form.8 min
- What a checkout screen costs, and what the research measuresThe checkout abandonment numbers everyone quotes, what they were actually measured on, and which reasons a redesign can move.8 min
- Using an agent to get a user to first valueOnboarding leaks where people have to type. An agent can collapse setup into one request, and there are four kinds of friction it genuinely cannot touch.8 min
- The metrics that tell you an in-app agent worksSeven numbers worth tracking, what each one hides, and why containment is the one that looks best while telling you least about the feature.9 min
- Conversational commerce numbers that survive checkingWe opened every source behind the statistics people quote about voice and AI shopping. Here is what held up, what did not, and what nobody has measured.10 min
- Build vs buy: what an in-app agent really costs to ownWiring a speech API to a model takes an afternoon. The nine workstreams that turn it into something you can hand to a user do not have an end date.10 min
- The business case for an in-app agent, and its missing numberHow to build an ROI model for an in-app agent when the one input that decides the answer has no public benchmark, and which of the levers you can honestly measure.8 min
- Agents in a travel app: rebooking is the feature worth buildingBooking is already a form. The task an agent is uniquely good at is rebooking under disruption, and it needs four read tools before it can answer anything.8 min
- Agents in a logistics app: the driver's hands are the constraintHands-free is a legal requirement in a cab, not a convenience. What a logistics agent should do, how proof of delivery works spoken, and the offline case.8 min
- An agent in a healthcare app: booking, refills, and the stop lineThe three patient-facing tasks an in-app agent does well, the escalation line that belongs in code, and the compliance question to settle before any of it.9 min
- Agent runtimes for mobile apps: an honest comparison (2026)OpenAI Realtime, LiveKit, ElevenLabs, Vapi and Retell compared on what a mobile team actually chooses between: layer coverage, client SDKs and the write path.8 min
- Where in-app agents are being adopted fastestAdoption is running ahead of the English-speaking world in several large markets. What that means for a team shipping an agent outside its home country.10 min
- What the first week of real assistant traffic teaches youReal users ask for things no test plan contains. Three questions only live traffic answers, and the metric that looks good while telling you nothing.10 min
Elsewhere on the map
- What an in-app AI agent actually is, and what it can touchThree different things get called an AI agent in a mobile app. Here is the one that lives inside your product and acts through your own backend.Agent basics11 min
- When not to put an AI agent in your appFour situations where an in-app agent loses to the interface you already have, and the test to run before you commit a quarter to building one.Agent basics10 min
- Agent or chatbot: telling the two apart before you buyA support bot answers questions. An in-app agent finishes the task. Five questions that separate them in any vendor demo, and where a chatbot still wins.Agent basics10 min